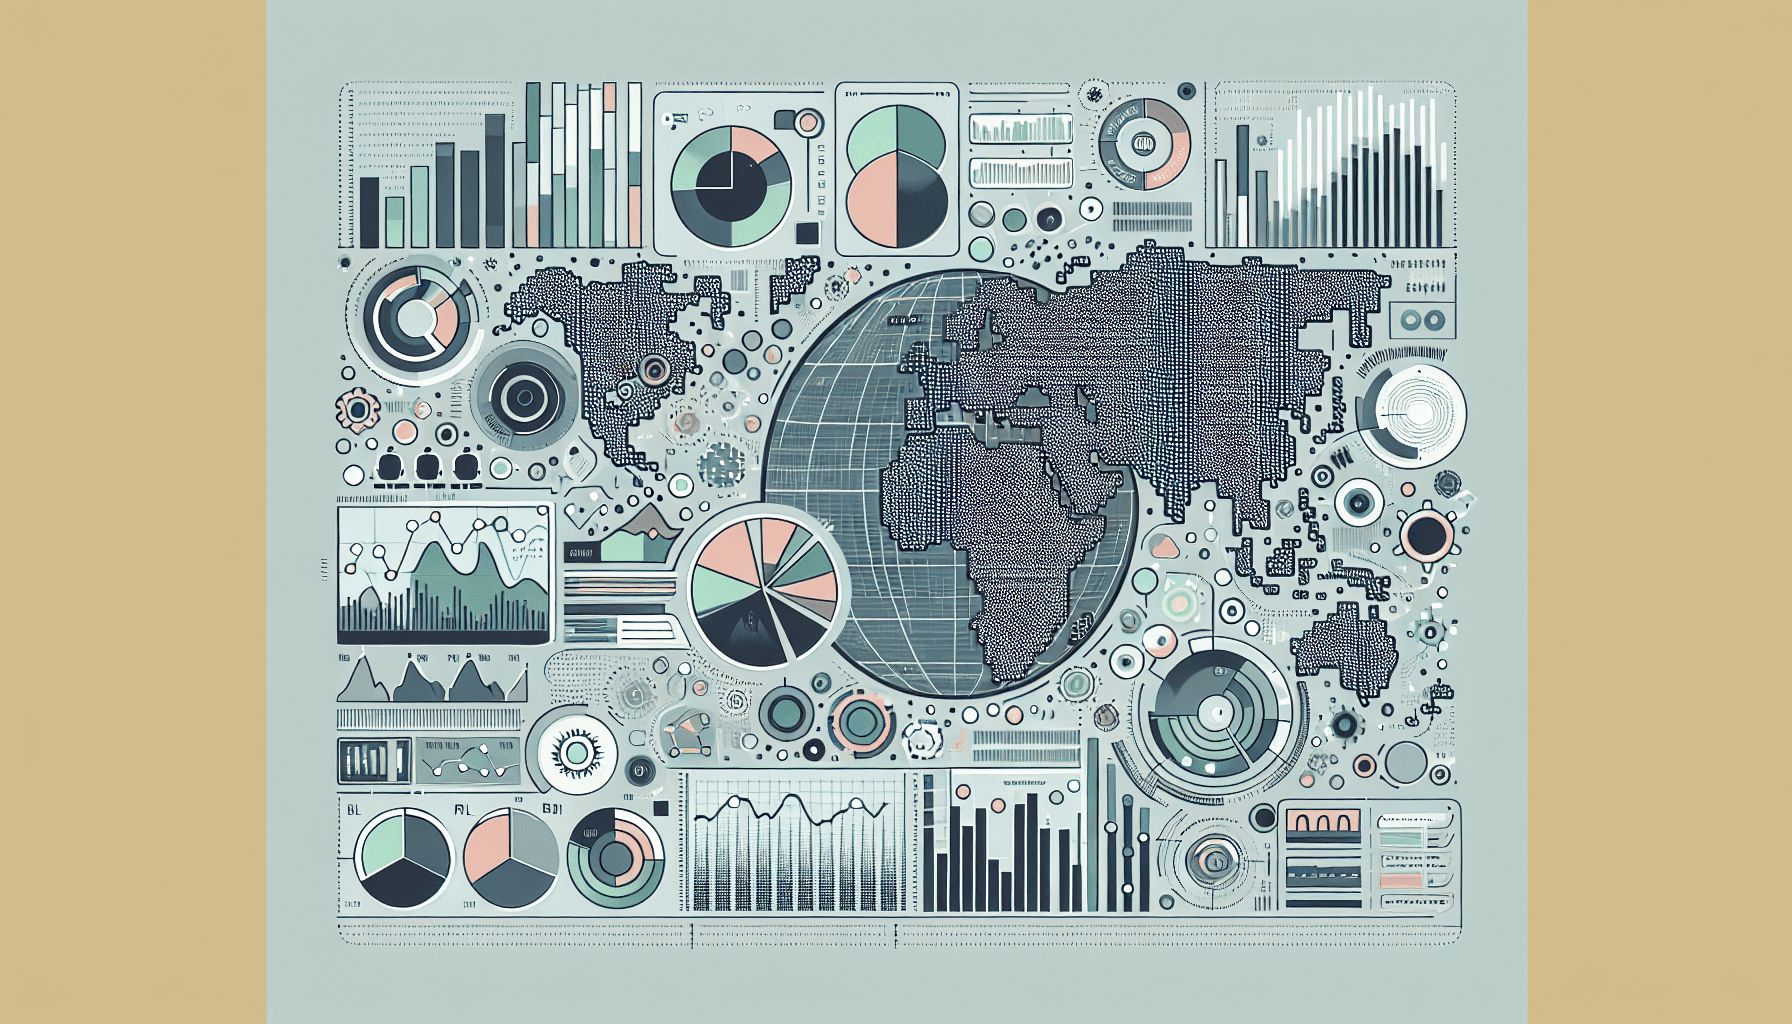
BI Dashboard The Nucleus of Data Analysis and Business Intelligence

BI Dashboard Briefly Summarized
- A BI Dashboard is a visual display of the most important information needed to achieve one or more objectives, consolidated and arranged on a single screen.
- It provides at-a-glance views of key performance indicators (KPIs) relevant to business processes or strategies.
- Dashboards are used to monitor, analyze, and visually summarize complex data in an intuitive way.
- They are interactive tools that allow users to drill down into data for deeper analysis.
- BI Dashboards are essential for data-driven decision-making and can be customized to meet the specific needs of any organization.
In the realm of data analysis and business intelligence, a BI Dashboard stands as a pivotal tool, harmonizing complex data streams into coherent visuals that drive strategic decisions. This article delves into the essence of BI Dashboards, their functionality, benefits, and how they have become indispensable in the modern data-centric business landscape.
Introduction to BI Dashboards
In the digital age, where data is the new currency, the ability to interpret vast amounts of information quickly and accurately is crucial for business success. Here is where Business Intelligence Dashboards, or BI Dashboards, come into play. Drawing parallels from the vehicle dashboard mentioned in Wikipedia, which displays critical information at a glance, a BI Dashboard serves a similar purpose in the business environment. It is a graphical user interface that showcases data analytics and visualization, often reflecting the health and performance of an organization.
The Anatomy of a BI Dashboard
A well-structured BI Dashboard typically includes several components:
- Key Performance Indicators (KPIs): These are the vital metrics that reflect the success factors of the business.
- Charts and Graphs: Visual representations of data that make trends and patterns easily identifiable.
- Interactive Elements: Features that allow users to manipulate data in real-time, such as filters and drill-down capabilities.
- Real-time Data Feeds: Integration with live data sources to provide up-to-the-minute information.
Creating a BI Dashboard
The process of creating a BI Dashboard, as outlined by resources like Microsoft Learn and Tableau, involves several steps:
- Identifying the Data Set: Determine what data is most relevant to the objectives of the dashboard.
- Data Source Connection: Establish a link to the data sources that will feed information into the dashboard.
- Data Relationships: Define how different data sets relate to each other within the dashboard.
- Visualization Design: Choose the appropriate charts and graphs to represent the data effectively.
- Interactivity and Customization: Implement interactive elements and customize the dashboard to fit the user's needs.
The Significance of BI Dashboards
BI Dashboards are more than just a visual aid; they are a decision-making engine for businesses. They provide a 360-degree view of an organization's performance, as mentioned by Domo. This holistic perspective is essential for leaders who need to make informed decisions quickly. By presenting data in an easy-to-digest format, BI Dashboards democratize data analytics, making it accessible to users at all levels of an organization.
Best Practices for BI Dashboard Design
To maximize the effectiveness of a BI Dashboard, certain best practices should be followed:
- Simplicity: Avoid clutter and focus on what's most important.
- Relevance: Tailor the dashboard to the audience and their specific needs.
- Consistency: Use a coherent design language for easy interpretation.
- Accessibility: Ensure that the dashboard is accessible on various devices and platforms.
- Actionability: Present data that leads to actionable insights.
BI Dashboard Tools and Technologies
Several tools and technologies are available for creating BI Dashboards, such as Power BI, Tableau, and DevExpress. These platforms offer a range of functionalities, from embedding interactive reports into applications to providing cloud-based analytics services.
Conclusion

BI Dashboards are the linchpin of modern data analysis and business intelligence strategies. They transform raw data into strategic insights, fostering a culture of informed decision-making. As businesses continue to navigate the complexities of the digital economy, the role of BI Dashboards will only grow in significance.
FAQs on BI Dashboard
Q: What is a BI Dashboard? A: A BI Dashboard is a visual representation tool that displays the most critical business data in an intuitive and interactive format, enabling quick and informed decision-making.
Q: Why are BI Dashboards important? A: BI Dashboards are important because they provide a quick and clear way to monitor, analyze, and visualize key business metrics, helping organizations to track performance and identify areas for improvement.
Q: Can BI Dashboards be customized? A: Yes, BI Dashboards are highly customizable, allowing businesses to focus on the specific metrics that are most relevant to their goals and processes.
Q: What are some common features of a BI Dashboard? A: Common features include interactive charts and graphs, real-time data updates, drill-down capabilities, and the ability to track KPIs.
Q: What tools can be used to create a BI Dashboard? A: Tools such as Microsoft Power BI, Tableau, Sisense, and DevExpress are popular for creating BI Dashboards, offering a range of features and integrations to suit different business needs.
Sources
- Dashboard
- Dashboard
- Introduction to dashboards for Power BI designers - Microsoft Learn
- Lo que necesitas saber sobre los dashboards de BI - Tableau
- What is a Business Intelligence Dashboard (BI Dashboard)?
- ¿Cómo crear un dashboard en Power BI?
- What You Need To Know About Business Intelligence (BI) Dashboards
- The basics of business intelligence dashboards | Domo
- BI Dashboard for .NET Angular, React, and Vue - DevExpress
- BI Dashboard Examples - Sisense
- Power BI Sign in